
English Learners in California Schools
Information, resources, and educational outcomes for English Learner students.California has the largest English learner (EL) student population in the nation. In order to ensure EL students are receiving appropriate services and making progress towards English language proficiency, the California Department of Education (CDE) monitors and reports on the educational outcomes for EL students and is committed to closing achievement gaps. This web page provides information, resources, and educational outcomes for EL students. Select one of the tabs below to access specific information or resources for EL students.
The CDE provides many free and publicly available resources to help assist English learner (EL) students, parents, districts, and schools. To access these additional resources, please visit the English Learners web page.
English Learner Population in California
California has the largest English learner (EL) student population in the nation. This tab provides an overview of California’s EL student population in 2022–23.
For definitions of terms used in these reports, please visit Glossary of Terms for English Learner (EL) Reports
2022–2023 Student Enrollment
- 5,852,544 total student enrollment for kindergarten through grade 12
- 1,112,535 are current English Learners (ELs), 19.0% of California's 5.9 million students are EL students
- 927,723 are Reclassified Fluent English Proficient (RFEP), 15.9% of California's 5.9 million students are RFEP students
2022–2023 Ever-ELs
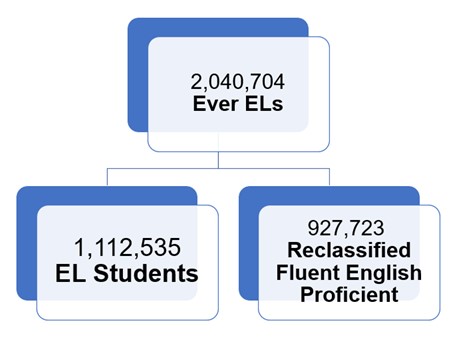
As indicated in the flow chart below, there are 2,040,704 Ever-ELs. The number of Ever-ELs is a combination two boxes at the bottom: 1,112,535 EL students and the 927,723 RFEP students.
Enrollment by EL Status
As indicated in the pie chart below, there are 2,040,258 Ever-ELs in 2022–23.
Data Source : 2022–23 "At – Risk" and Long-Term English Learners (LTEL) by Grade.
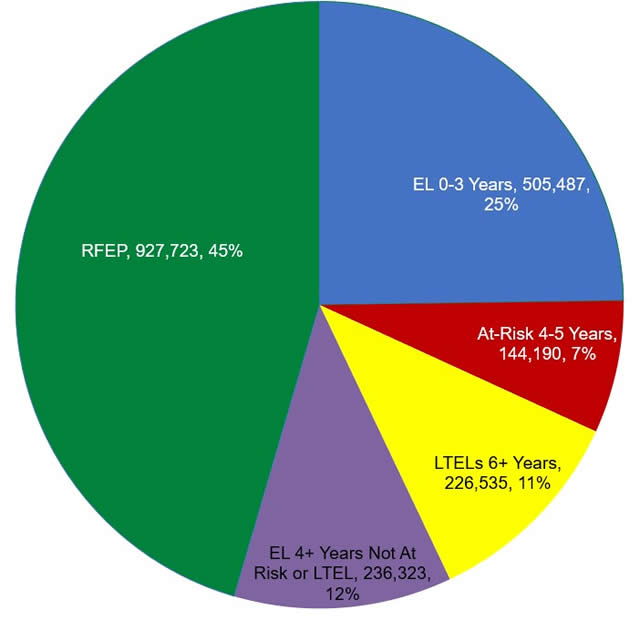
Out of the 2,040,258 Ever-ELs in California, 927,723 (45.5%) are RFEPs, 505,487 497,471 (24.8%) have been ELs for less than three years, 144,190 (7.1%) are At-Risk of becoming LTEL, 226,535 (11.1%) are LTEL, and 236,323 (11.6%) have been ELs for more than four years but are not At-Risk or LTEL.
State Level Educational Outcomes of English Learner Students
The outcomes for English learners (EL) students are annually reported on DataQuest. DataQuest is the California Department of Education’s online, public reporting system that provides reports about California’s schools and school districts. To find out how to access reports specifically for EL on DataQuest, view these Instructions on Accessing Data (DOCX).
Percent of Students Meeting or Exceeding Standards - 2022–2023 Smarter Balanced Summative Assessment in English Language Arts/Literacy
The graph below displays the 2022–2023 school year percent of EL, Reclassified Fluent English Proficient (RFEP), Ever EL, and English only students meeting or exceeding standards on the Smarter Balanced Summative Assessment in English language arts/literacy (ELA).
For definitions of the different EL student groups on the Smarter Balanced Summative Assessment, please visit English Language Arts/Literacy and Mathematics
![]()
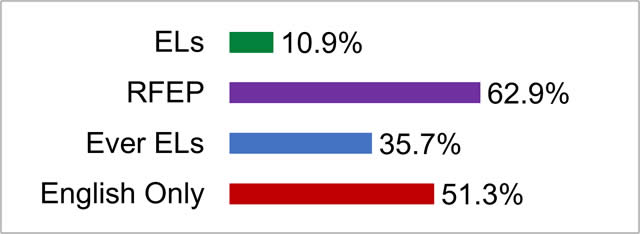
The Smarter Balanced Summative Assessment in ELA is only offered in grades 3-8 and grade 11. The results of the Smarter Balanced Summative Assessment in ELA is as follows:
- Out of 500,179 EL students with scores, 10.9 percent of EL students met or exceeded standards on the Smarter Balanced Summative Assessment ELA.
- Out of 557,303 RFEP students with scores, 62.9 percent of RFEP students met or exceeded standards on the Smarter Balanced Summative Assessment ELA.
- Out of 1,057,599 Ever ELs with scores, 35.7 percent of Ever ELs met or exceeded standards on the Smarter Balanced Summative Assessment ELA.
- Out of 1,757,061 English only students with scores, 51.3 percent of English only students met or exceeded standards on the Smarter Balanced Summative Assessment ELA.
Percent of Students Meeting or Exceeding Standards - 2022–2023 Smarter Balanced Summative Assessment in Mathematics
The graph below displays the 2022–2023 school year percent of EL, RFEP, Ever EL, and English only students meeting or exceeding standards on the Smarter Balanced Assessment in mathematics.
For definitions of the different EL student groups on the Smarter Balanced Summative Assessment results, please visit English Language Arts/Literacy and Mathematics
![]()
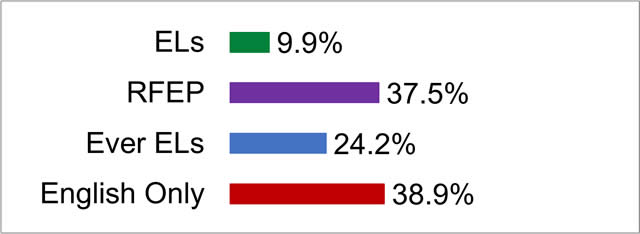
The Smarter Balanced Summative Assessment in mathematics is only offered in grades 3-8 and grade 11. The results of the Smarter Balanced Summative Assessment in mathematics is as follows:
- Out of 517,490 EL students with scores, 9.9 percent of EL students met or exceeded standards on the Smarter Balanced Summative Assessment mathematics.
- Out of 556,250 RFEP students with scores, 37.5 percent of RFEP students met or exceeded standards on the Smarter Balanced Summative Assessment mathematics.
- Out of 1,073,852 Ever ELs with scores, 24.2 percent of Ever ELs met or exceeded standards on the Smarter Balanced Summative Assessment mathematics.
- Out of 1,750,595 English only students with scores, 38.9 percent of English only students met or exceeded standards on the Smarter Balanced Summative Assessment mathematics.
2022–2023 Percent of Students Chronically Absent
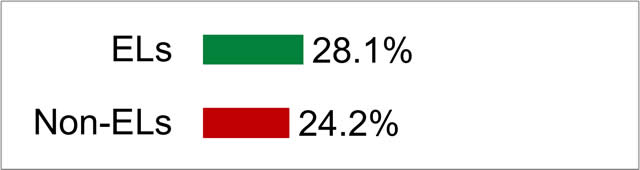
The graph below displays the 2022–2023 school year chronic absenteeism rates for EL students and non-EL students. Chronic absence rate is calculated as the percent of students who miss ten percent or more of the days they are expected to attend. Statewide, EL students had a chronic absenteeism rate of 28.1 percent, compared to 24.2 percent for non-EL students.
For definitions on the different EL student groups on DataQuest reports, please visit Glossary of Terms for English Learner (EL) Reports.
2022–2023 Suspension Rate
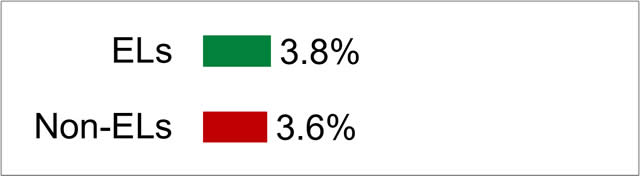
The 2022–2023 school year suspension rates for EL students and non-EL students. Suspension rate is calculated as the percent of all students who were suspended one or more times during the school year for an in-school or out-of-school suspension. Statewide, EL students had a suspension rate of 3.8 percent comparted to 3.6 percent for non-EL students.
For definitions on the different EL student groups on DataQuest reports, please visit Glossary of Terms for English Learner (EL) Reports.
2022–2023 Stability Rate
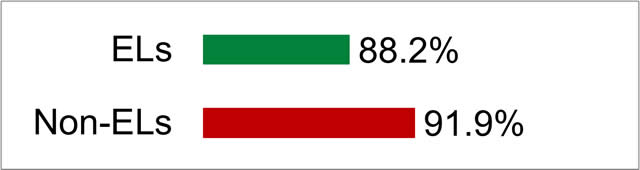
The graph below displays the 2022–2023 school year stability rates for EL students and non-EL students. Stability rate is calculated as the percent of students with a minimum of 245 consecutive calendar days at the same school without a disqualifying exit (e.g., truant, expelled). Statewide EL students had a stability rate of 88.2 percent compared non-EL students stability rate of 91.9 percent.
2022–2023 Four- Year Cohort Graduation Rate
The graph below displays the 2022–2023 school year four-year cohort graduation rates for EL students and non-EL students. The four-year cohort graduation rate is calculated as the percent of students who graduate high school with a traditional high school diploma within four years from the time they enter ninth grade. Statewide, 72.5 percent of EL students graduated within 4 years compared to 88.6 percent of non-EL students.
For definitions on the different EL student groups on DataQuest reports, please visit Glossary of Terms for English Learner (EL) Reports.

2022–2023 Five- Year Cohort Graduation Rate
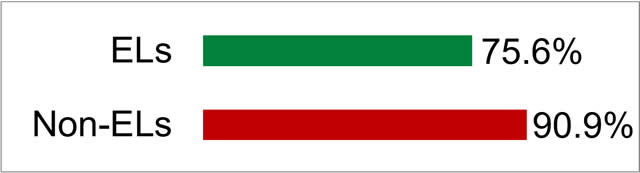
The graph below displays the 2022–2023 school year five-year cohort graduation rates for EL students and non-EL students. The five-year cohort graduation rate is calculated as the percent of students who graduate high school with a traditional high school diploma within five years from the time they enter ninth grade. Statewide, 75.6 percent of EL students graduated within 5 years compared to 90.9 percent non-EL students.
For definitions on the different EL student groups on DataQuest reports, please visit Glossary of Terms for English Learner (EL) Reports.
State Level Accountability for English Learners
Accountability results for English learner (EL) students, outlined below, are published annually on the California School Dashboard (Dashboard). The Dashboard provides information about how local educational agencies (LEAs) and schools are meeting the needs of California's diverse student population. The results on this tab represent EL results statewide on the 2023 Dashboard. To find out how LEAs and schools are meeting the needs of their EL students, visit the California School Dashboard
![]()
To find out how to access statewide indicators specifically for EL students on the California School Dashboard, view these Instructions on Accessing Data (DOCX).
For more information on how the EL student group is defined for each state indicator on the Dashboard, please visit English Learner Students on the California School Dashboard(PDF)
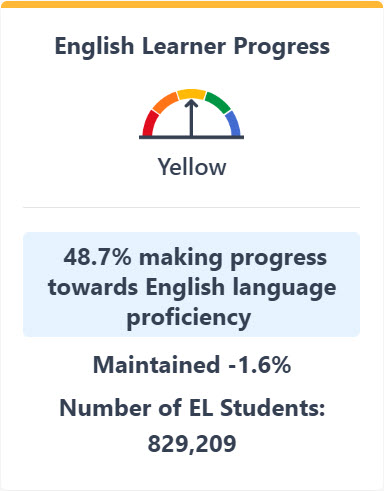
English Learner Progress – 2023
The English Learner Progress Indicator (ELPI) measures the rate that EL students are progressing towards English language proficiency. The 2023 ELPI gauge is pointing to yellow. In 2023, 48.7 percent of EL students made towards English language proficiency. This rate declined 1.6 percent from the previous year. This is based on 829,209 EL students statewide.
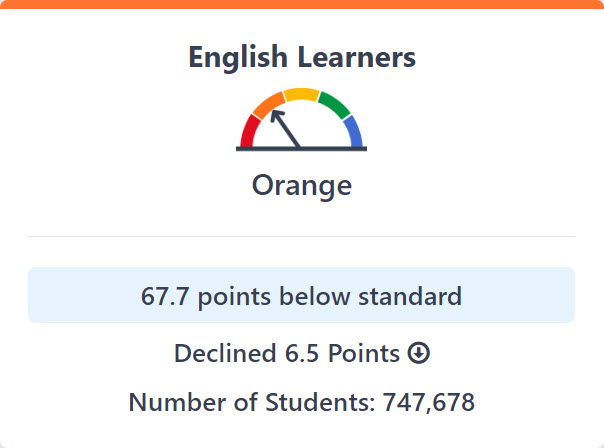
English Language Arts/Literacy – 2023
The English Language arts/literacy (ELA) indicator shows how well students are at meeting grade-level standards on the Smarter Balanced Summative Assessment in ELA. The Smarter Balanced Summative Assessment in ELA is administered in grades 3-8 and grade 11. The ELA indicator combines current EL students and students who have been reclassified within the last four years. The 2023 ELA gauge for EL students is pointing to orange. In 2023, current EL students and recently reclassified EL students scored an average of 67.7 points below standard. This number declined 6.5 points from the previous year. This is based on 747,678 current EL students and recently reclassified EL students statewide who took the Smarter Balanced Summative Assessment in ELA.
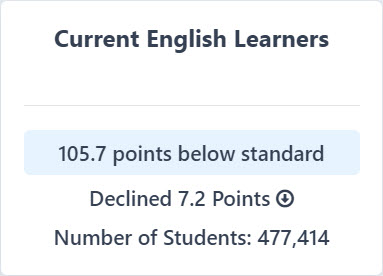
In 2023, current EL students scored an average of 105.7 points below standard. Current EL students declined 7.2 points from the previous year. This is based on 477,414 current EL students statewide who took the Smarter Balanced Summative Assessment in ELA.
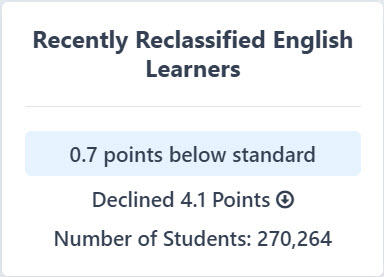
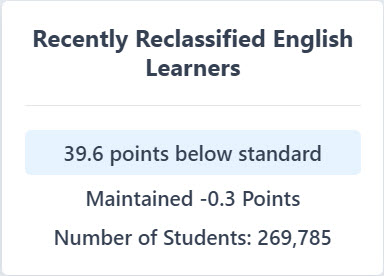
In 2023, reclassified EL students scored an average of 0.7 points below standard. Reclassified students declined 4.1 points from the previous year. This is based on 270,264 reclassified EL students who took the Smarter Balanced Summative Assessment in ELA.
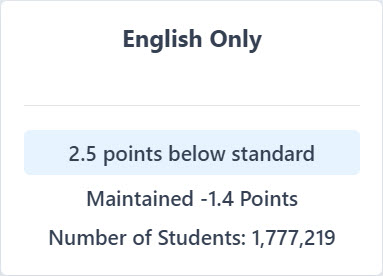
In 2023, English only students scored an average of 2.5 points below standard. English only students declined 1.4 points from the previous year. This is based on 1,777,219 English only students who took the Smarter Balanced Summative Assessment in ELA.
Mathematics – 2023
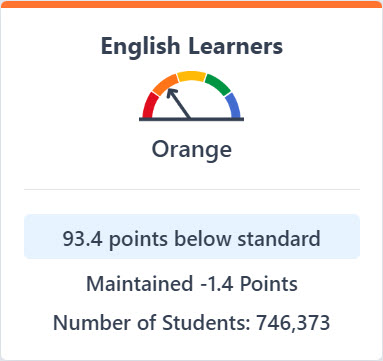
The mathematics indicator shows how well students are at meeting grade-level standards on the Smarter Balanced Summative Assessment in mathematics. The Smarter Balanced Summative Assessment in mathematics is administered in grades 3-8 and grade 11. The mathematics indicator combines current EL students and students who have been reclassified within the last four years. The 2023 ELA gauge for EL students is pointing to orange. In 2023, current EL students and recently reclassified EL students scored an average of 93.4 points below standard. This number declined 1.4 points from the previous year. This is based on 746,373 current EL students and recently reclassified EL students statewide who took the Smarter Balanced Summative Assessment in mathematics.
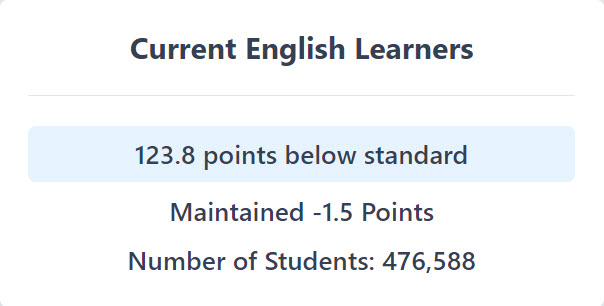
In 2023, current EL students scored an average of 123.8 points below standard. Current EL students declined 1.5 points from the previous year. This is based on 476,588 current EL students statewide who took the Smarter Balanced Summative Assessment in mathematics.
In 2023, reclassified EL students scored an average of 39.6 points below standard. Reclassified EL students declined 0.3 points from the previous year. This is based on 269,785 reclassified EL students who took the Smarter Balanced Summative Assessment in mathematics.
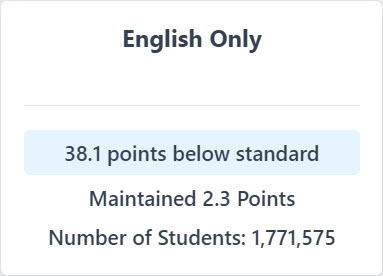
In 2023, English only students scored an average of 38.1 points below standard. English only students increased 2.3 points from the previous year. This is based on 1,771,575 English only students who took the Smarter Balanced Summative Assessment in mathematics.
Chronic Absenteeism – 2023
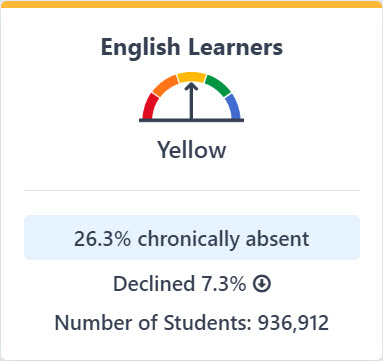
The chronic absenteeism rate is calculated as the percent of students who miss ten percent or more of the days they are expected to attend. The chronic absenteeism gauge for EL students is pointing to orange. In 2023, 26.3 percent of EL students were chronically absent. This is a decrease of 7.3 percent from the previous school year. This is based on 936,912 EL students statewide.
Suspension Rate – 2023
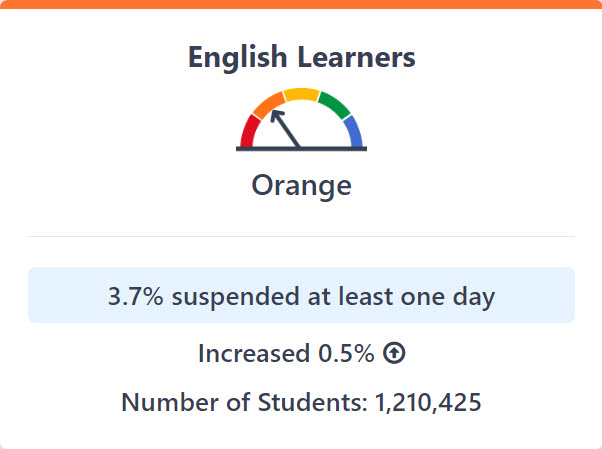
The suspension rate is calculated as the percent of all students who were suspended one or more times during the school year for an in-school or out-of-school suspension. The suspension gauge for EL students is pointing to orange. In 2023, 3.7 percent of EL students were suspended at least once. This rate increased by 0.5% from the previous school year. This percent is based on 1,210,425 EL students statewide.
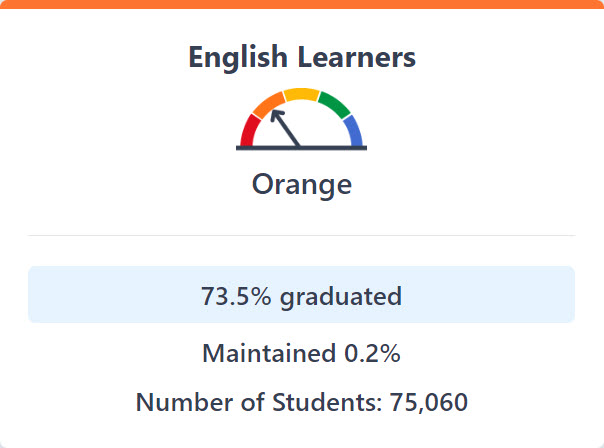
Graduation – 2023
The graduation rate for the California School Dashboard is the combined four-and five-year graduation rate. In 2023, 73.5 percent of EL students graduated high school. This rate increased 0.2 percent from the previous school year. This is based on 75,060 English learner students. More information on this graduation rate calculation can be found in the 2023 Graduation Rate Mini Guide(DOCX).
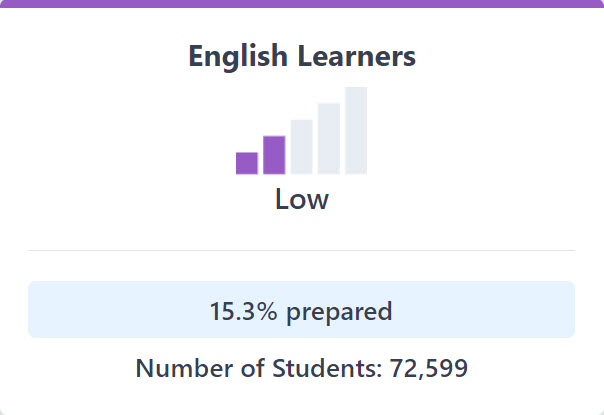
College/Career – 2023
The college/career rate is calculated as the percent of students who are prepared for success after graduation. The 2023 College/Career cell phone bar has two bars in purple indicating a Status level of Low. In 2023, 15.3 percent of EL students are prepared for success after graduation. This is based on 72,599 EL students statewide.
EL Roadmap
The California English Learner Roadmap: Strengthening Comprehensive Educational Policies, Programs, and Practices for English Learners (CA EL Roadmap) was adopted by the State Board of Education (SBE) in July 2017. The CA EL Roadmap is a Guide to assist local educational agencies to implement California's 21st century college-and-career-ready standards, curriculum, instruction programs, and assessments.
The CA EL Roadmap policy outlines four main principles:
- Principle One: Assets-Oriented and Needs Responsive Schools
- Principle Two: Intellectual Quality of Instruction and Meaningful Access
- Principle Three: System Conditions that Support Effectiveness
- Principle Four: Alignment and Articulation Within and Across Systems
For more information and resources on the CA EL Roadmap, please visit English Learner Roadmap.
English Learners Monitoring
The California Department of Education is committed to moving all of California’s English learner (EL) students to English language proficiency as rapidly and effectively as possible. In order to meet this goal, the CDE provides monitoring and technical assistance to local educational agencies on the EL program and services.
For more information, please visit the CDE’s Technical Assistance and Monitoring web page at Technical Assistance and Monitoring.
Downloadable English Learner Data Files
The California Department of Education makes available several downloadable data files on English learners.
- English Learners
English learners by grade and language. - Fluent-English-Proficient (FEP)
FEP students by grade and language. - Reclassified Fluent English Proficient (RFEP)
EL students reclassified from EL to FEP since the last census. - Long-Term English Learner (LTEL)
Enrollment by English Language Acquisition Status (ELAS), LTEL status, and At-Risk of becoming LTEL status by grade.
2019 English Learner Progress Indicator (ELPI) Status
ELPI Status measures progress toward English language proficiency.
EL Definitions
This tab provides information and resources on how English Learner (EL) students are defined across the various data reports provided by the California Department of Education (CDE). This tab also provides information on additional resources for EL students, parents, schools, and districts.
EL Definitions
General Definitions
This section provides general definitions of ELs, Reclassified Fluent English Proficient (RFEP) students, and those students who were ever English Learners (Ever-ELs).
- English Learner – A student who enrolls in a California school beginning in any grade level, transitional kindergarten through grade twelve, has a language other than English identified on the Home Language Survey, and upon assessment, obtained a level of English proficiency that indicates programs and services are necessary. Students identified as English learners receive programs and services until they meet the reclassification criteria pursuant to Education Code (EC) Section 313.
- Reclassified Fluent English Proficient Student – A former EL student who has met the four criteria specified in California EC Section 313(f). For more information on the four criteria for reclassification, please visit Reclassifications web page.
- Ever-ELs – Current EL students and RFEP students.
Long-Term English Learners (LTELs) and At-Risk for LTEL
For definitions of Long-Term English Learners and students “At-Risk” of becoming Long-Term English Learners, please visit Glossary of Terms for English Learner (EL) Reports.
DataQuest Reports
For definitions on the different EL student groups on DataQuest reports, please visit the Glossary of Terms for English Learner (EL) Reports.
Smarter Balanced Summative Assessment in ELA and Mathematics
For definitions of EL students, Ever ELs, and English only students on the Smarter Balanced Summative Assessment, please visit English Language Arts/Literacy and Mathematics
![]() .
.
For additional information on the achievement of EL students, please visit Understanding English Learner Achievement in California (PDF).
Initial and Summative English Language Proficiency Assessments for California (ELPAC)
For definitions of EL students on the Initial ELPAC, please visit Understanding Initial ELPAC Summary Reports
![]() .
.
For definitions of EL students on the Summative ELPAC, please visit Understanding Summative ELPAC Summary Reports
![]() .
.
California School Dashboard
The California School Dashboard (Dashboard) has six state indicators. These indicators are reported at the student group level (i.e., race/ethnicity, foster youth, EL, homeless). However, students included in the EL student group vary by state indicator. Please visit Who is Included in the English Learner Student Group? (PDF) for an explanation of how the English learner student group is included in each indicator.