
2023 Assessment Data Release FAQs
Frequently asked questions related to the release of 2023 California Assessment of Student Performance and Progress (CAASPP) and English Language Proficiency Assessments for California (ELPAC) statewide results.How did the demographics of the students tested in the 2022–23 school year change from the prior year?
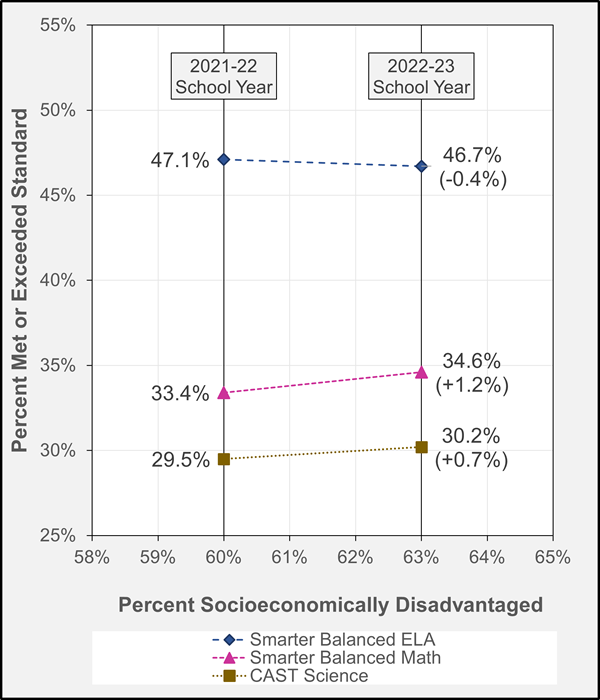
There have been significant changes in the California public school population. Since 2019, the state has seen a drop of over 300,000 students enrolled in K – 12 public schools. We have also seen an increase in the number of students with greater needs. The proportion of students tested who are socioeconomically disadvantaged increased from 60 percent in 2022 to 63 percent in 2023. The number and share of students who are experiencing homelessness or who are part of the foster care system has also increased.
| Socioeconomically Disadvantaged | English Language Arts/Literacy | Mathematics | Science | |
|---|---|---|---|---|
| 2021–22 | 60.0% | 47.1% | 33.4% | 29.5% |
| 2022–23 | 63.0% | 46.7% | 34.6% | 30.2% |
| Difference between 2022-23 and 2021-22 | 3.0% | -0.4% | 1.2% | 0.7% |
How well did students perform on the California Assessment of Student Performance and Progress overall?
The California Assessment of Student Performance and Progress (CAASPP) scores showed hopeful signs of recovery. Overall, California students made small gains in mathematics (+1.2 percentage points) and science (+0.7 percentage points). The percentage of students who met or exceeded standard on the Smarter Balanced Summative Assessment for Mathematics increased from 33.4 percent in 2021–22 to 34.6 percent in 2022–23, with the mean scale scores increasing in all grades. For the California Science Test (CAST), student scores were generally consistent with pre-pandemic levels, showing a continued improvement with a small increase from the prior year, moving from 29.5 percent in 2021–22 to 30.2 percent in 2022–23. Results also improved in the California Alternate Assessments (CAAs), given to students with the most significant cognitive disabilities. The percentage of students who met Level 3 increased on both the CAA English language arts (ELA) (+1.6) and the CAA Mathematics (+0.6) in 2022–23. The percentage of students meeting or exceeding the standard for the Smarter Balanced Summative Assessment for ELA did not change significantly, decreasing by just 0.4 percentage points from 47.1 percent in 2021–22 to 46.7 percent in 2022–23, with mean scale scores in most grades mirroring this trend, but increasing in grades 3 and 11.
How does student performance in California compare to other states?
Student performance has been slow to recover nationally. The 2023 release of National Assessment of Educational Progress (NAEP) long-term trend data in reading and mathematics showed significant declines in both subject areas. In 2022, the most recent NAEP administration allowing state comparisons to 2019, before the pandemic, California’s scores declined less than the national average in mathematics and 4th grade reading and did not decline at all in 8th grade reading, in contrast to most states.
While the NAEP allows direct comparisons across states, results on state tests do not, because states use different assessments and choose different cut scores, making comparability across states difficult. Looking across state assessment results, California mirrored the national trend of generally maintaining achievement in ELA and achieving a slight increase in mathematics. When considering other states administering the Smarter Balanced Summative Assessments, such as Oregon
![]() , Nevada
, Nevada
![]() , Connecticut
, Connecticut
![]() , Delaware
, Delaware
![]() , and Washington
, and Washington
![]() , the trend was similar to the California results, small gains in mathematics and slight losses to static change in ELA. The Smarter Balanced Assessments differ from those administered in most states because they include more complex performance assessments and, in English language arts, measure research, writing, and listening as well as reading. For more details on each California assessment and student group results, refer to the Test Results for California’s Assessments website
, the trend was similar to the California results, small gains in mathematics and slight losses to static change in ELA. The Smarter Balanced Assessments differ from those administered in most states because they include more complex performance assessments and, in English language arts, measure research, writing, and listening as well as reading. For more details on each California assessment and student group results, refer to the Test Results for California’s Assessments website
![]() .
.
How well did the student groups perform on the CAASPP?
Achievement within student groups was largely consistent with the overall trends for all students. For most student groups, ELA results held steady while results in mathematics and science saw slight gains. ELA results for grades 3 and 11 increased slightly while other grades showed slight decreases.
Refer to the Test Results for California’s Assessments website![]() for a detailed picture of how 2022–23 results for each student group compare against the state average as well as against prior administration years.
for a detailed picture of how 2022–23 results for each student group compare against the state average as well as against prior administration years.
What explains the difference between the changes of student performance in mathematics and English language arts/literacy results?
In 2023, although both ELA and mathematics achievement have yet to return to pre-pandemic levels, mathematics achievement appears to be rebounding at a greater rate. Some of this rebound may be attributable to state investments in high-dose tutoring and the state’s recent expansion of after school and summer learning, which research indicates may have a greater impact on math achievement.
Statewide, there was a decline in both ELA and mathematics achievement between 2019 and 2022. The percentage of students meeting or exceeding standard on the 2022 Smarter Balanced Summative Assessments declined by 4 percentage points (from 51 percent to 47 percent) for ELA and 7 percentage points (from 40 percent to 33 percent) for mathematics when compared to students who took the tests in 2018–19—before the pandemic. These assessment results indicate that student mathematics performance was more greatly impacted by the COVID-19 pandemic than ELA performance and may also help to explain the more substantial rebound of math scores in 2023.
Assessment data should always be considered in conjunction with other student data and changes. It should be noted that there have been some important changes in the population of students in our schools, with the degree of disadvantage having increased from 2022 to 2023. Specifically, the proportion of students in tested grades who are socioeconomically disadvantaged increased from 60 percent to 63 percent, and the number and share of students who are experiencing homelessness or who are part of the foster care system also increased.
What may have been a factor in the increases in mathematics results overall and in 3rd and 11th grade English language arts/literacy results?
A change in overall test results across the state cannot be attributed to any one thing. It may be possible that the state’s efforts and focus on early literacy to increase grade-level reading proficiency among young readers in the early grades and investments in expanding early education may have positively impacted grade three ELA results. Similarly, the funding for before and after-school, summer school, and high-dose tutoring may have had some benefit on mathematics results overall. It is also worth noting that the general trends of increases in mathematics results and static or slight decreases in ELA results mirror national trends in state assessment data results The CDE will continue to analyze the data and the impact on student performance. The State Superintendent of Public Instruction’s focus on measurable outcomes for grant funding and allocations will continue to help us better understand the connections between funding, programs, and staff and student impact.
Is California still using the adjusted blueprint for the Smarter Balanced Summative Assessments for English Language Arts/Literacy and Mathematics?
Yes. Prior to the beginning of the 2020–21 administration, the State Board of Education (SBE) adopted the use of the adjusted form blueprint for the Smarter Balanced Summative Assessments for ELA and Mathematics. In September 2022, the SBE approved use of the adjusted blueprints for the 2022–23 administration and for subsequent administrations until the Smarter Balanced Assessment Consortium approves any changes to the adjusted form blueprints. The blueprints have remained unchanged since that time.
Can results from the adjusted blueprint be compared with results from years that did not use the adjusted blueprint?
The 2022–23 results are comparable to the 2021–22 and prior years' CAASPP results. The CDE and its testing contractor, ETS, have performed validity and reliability studies comparing the full form blueprints to the adjusted form blueprints and have concluded that the results from the adjusted form blueprints are reliable and can be compared to those from the full form blueprints used in 2018–19 and earlier administrations.
How well did English learner students do on the Summative English Language Proficiency Assessments for California?
The percentage of English learner students who earned the highest overall performance level of 4 on the Summative English Language Proficiency Assessments for California (ELPAC), the level needed to meet criterion one of four criteria for reclassification, increased nearly 1 percentage point from 15.6 percent in 2021–22 to 16.5 percent in 2022–23. All grade levels from grades 3 – 12 and kindergarten had increases in the percent of students earning an overall level 4 in 2022–23.
How did Summative English Language Proficiency Assessments for California results differ for more and less socioeconomically advantaged students?
The percentage of English learner students identified as socioeconomically disadvantaged who earned an overall performance level of 4 increased at a higher rate, from 14.4 percent in 2021–22 to 15.7 percent in 2022–23. Students who were not socioeconomically disadvantaged held steady at about 21 percent.
For more details on each ELPAC test and additional student group results, refer to the Test Results for California’s Assessments website
![]() .
.
How well did English learner students with the most significant cognitive disabilities do on the Summative Alternate English Language Proficiency Assessments for California?
The percentage of English learners who earned the highest overall performance level of 3 on the Summative Alternate ELPAC decreased by 2.6 percentage points from 28.7 percent in 2021–22 to 26.1 percent in 2022–23. This may be attributable to a slight increase of 4.7 percent in the test participation rate.
What can this data be used for?
Summative assessment results are only one indicator of student achievement. They should be used in conjunction with other indicators, such as report cards, teacher feedback, and classwork to provide a more complete picture of an individual student’s progress in school.
Throughout the year, educators also use diagnostic and formative assessments to gauge student progress toward mastering California’s challenging learning standards. These help teachers adjust instruction to make up for knowledge gaps and learning disparities between students.
In addition, parents and guardians receive individual student score reports so they can support learning outside of the classroom.
Aggregate assessment results should be used in conjunction with other data—such as high school graduation rates, student discipline data, attendance information and college readiness indicators—to get a fuller picture of how schools are helping students succeed. This data, broken down by student groups, is available on the California School Dashboard (with a 2023 release coming in December). This data is also used by schools working with their communities to develop Local Control and Accountability Plans (LCAPs). LCAPs empower families, educators, community partners, and students to analyze data to drive important decisions about the best use of state resources.
What additional funding was provided for programs to accelerate learning and support recovery efforts?
In recent years, the state has made historic investments in K-12 public education, with a focus on accelerating learning and prioritizing equity. For total K-12 school funding, the 2023 Budget Act provides $108.3 billion Proposition 98 General Fund, including a cost-of-living adjustment of 8.22 percent for the Local Control Funding Formula. In addition to billions of federal COVID-19 recovery funds, schools continue to benefit from $7.9 billion that the state provided in 2022 for the Learning Recovery Emergency Block Grant for school learning acceleration initiatives through 2028, and $3.6 billion for the Arts, Music, and Instructional Materials Discretionary Block Grant, which schools can use for any purpose.
Beginning in the 2022–23 school year, the state began allocating billions to expand access to transitional kindergarten for tens of thousands of four-year-old children, to improve kindergarten readiness and long-term student outcomes. The 2022 and 2023 Budget Acts also provided a total of $500 million to fund the Literacy Coaches and Reading Specialists Grant Program, which supports the development of school literacy programs and interventions to help pupils in need of targeted literacy support. Additionally, the 2023 Budget Act included $1 million to create a Literacy Roadmap to help educators apply the state’s curriculum framework to classroom instruction, navigate the resources and professional development opportunities available to implement effective literacy instruction, and improve literacy outcomes for all pupils with a focus on equity.
To increase the amount of time that kids can benefit from educational support and enrichment, beginning in 2021, the state allocated $4.4 billion one-time and $4 billion ongoing to expanding learning opportunities beyond traditional school hours. These programs are a key component of the state's $4.1 billion California Community Schools Partnership Program initiative, which supports schools’ efforts to partner with community agencies and local government to align community resources to improve student outcomes.
The 2023 Budget Act also included a new Equity Multiplier initiative that will provide an ongoing $300 million annually for school sites with a high percentage of socioeconomically disadvantaged pupils and with high non-stability rates. This funding was paired with significant changes to the state’s accountability system that will require schools to be more strategic in their fiscal planning to address school and demographically specific inequities.