
Foster Youth in California Schools
Information, resources, and educational outcomes for foster youth students.Students in foster care represent one of the most vulnerable and academically at-risk student groups enrolled in California schools. The California Department of Education (CDE) monitors the educational outcomes for foster youth and engages with multiple state agencies and non-profit organizations to ensure these students receive the supports and services they need. This web page provides information and resources related to foster youth in schools. Select one of the tabs below to access information on foster youth definitions or educational data and outcomes, among other resources, to learn more about the needs of these students and some of the different ways CDE is working to support counties, school districts, and schools to meet these needs.
Foster Youth Laws and Definitions
Statewide Match
The foster statewide match describes the data exchange between the California Department of Social Services (DSS) and the California Department of Education (CDE) as mandated by Education Code 49085. This education code requires DSS to provide CDE with weekly information for youth who meet the local control funding formula definition of “foster youth” as outlined in Education Code 42238.01 (b). This process matches CDE enrollment data in the California Longitudinal Pupil Achievement Data System (CALPADS) to enrollment and demographic records in CDSS held within the Child Welfare System/Case Management System (CWS/CMS) data system. CDE uses the foster statewide match to identify and inform County Offices of Education and Local Education Agencies (LEAs) of the foster youth enrolled in their schools through CALPADS foster reports.
Local educational agencies (LEAs) may also conduct local matches in CALPADS with their county welfare departments (CWDs). In this process, LEAs verify student demographic and enrollment data from local student information systems with data in CALPADS and manually match records in CALPADS using Case ID or Client ID from CWS/CMS. You can read more about conducting local foster matches via CALPADS guidance, Local Foster Match Maintenance.
Foster youth under the jurisdiction of a tribal court are identified separately from the match process between the CDE and the CDSS. These foster youth are identified by LEAs and that information is submitted to CALPADS through a program record (code 193). The Tribal Foster Youth Guidance Document(DOCX) provides guidance to LEAs on identifying tribal foster youth and reporting that information to CALPADS.
Information on Foster Youth in CALPADS Foster Reports
LEA staff with appropriate security roles have access to the CALPADS 5.7 Foster Youth Enrolled – Student List report, which includes the following information on foster youth who have been identified through the CDE-CDSS weekly match process:
- School Code
- School Name
- Statewide Student Identifier (SSID)
- Student Name
- Local ID
- Date of Birth (DOB)
- Gender
- Ethnicity/Race
- ELAS Status
- Migrant ED status
- Students with Disability status
- Grade Level
- Enrollment Start Date
- Enrollment Status
- Local Match indicator
- Statewide Match indicator
- County of jurisdiction
- Service Type: An indication of whether the student is receiving family maintenance services (i.e., living at home) or in a placement, including voluntary placement agreements
- Client ID (10-digit)
- Case ID (19-digit)
- Case Start Date
- Episode Start Date (the start of the foster placement)
- Episode End Date (the end of the foster placement)
- Social Worker Name
- Social Worker Phone Number
- Responsible Agency (Child Welfare or Probation)
- Whether parental rights are limited (Y/N)
- Court Appointed Educational Representative Name
- Court Appointed Educational Representative Phone Number
- Last Update Date
LEA staff with appropriate security roles have access to the CALPADS Fall 1 1.18 – Free or Reduced Price Meal (FRPM) / English Learner / Foster Youth – Student List report which indicates enrolled students who have been identified as a tribal foster youth by the LEA and reported to CALPADS
Definitions
Different definitions of children and youth in foster care are used in relation to programs, services, educational entitlements, and programmatic funding supporting foster youth in schools. These definitions can vary at both the state and federal levels. The foster youth definitions included here are a small subset of the information available in the foster youth definitions resource document created by the CDE.
The Foster Youth Definitions(XLSX) document was created to describe which of the different entitlements, supports, and services are afforded to each of the categories of foster youth. The Foster Youth Definitions document is for reference purposes only, may not be comprehensive, and is subject to change depending on federal and state statutes and regulations. The table below and the Foster Youth Definitions document will be updated as needed.
| CATEGORY OF FOSTER YOUTH | Included in Local Control Funding Formula (LCFF) | Included in Every Student Succeeds Act (ESSA) | Included in CDSS' Definition of Care and Placement | CA Foster Youth Educational Rights | Available in California Longitudinal Pupil Achievement Data System (CALPADS) via Foster Match Process |
|---|---|---|---|---|---|
| OUT-OF-HOME Child Welfare |
Yes | Yes | Yes | Yes | Yes |
| OUT-OF-HOME Probation |
Yes | Yes | Yes | Yes | Yes |
| IN-HOME PROBATION | Not Included | Not Included | Not Included | Yes | Not Available |
| FAMILY MAINTENANCE |
Yes | Not Included | Not Included | Yes | Yes |
| NON-MINOR DEPENDENTS | Yes | Yes | Yes | Yes | Yes |
| VOLUNTARY PLACEMENT AGREEMENTS |
Yes | Yes | Yes | Yes | Yes |
| TRIBAL FOSTER YOUTH (AB 1962) | Yes | Only for Title IV-E tribes | N/A | Yes | In CALPADS, but not via Foster Match process |
| EMERGENCY REMOVALS | Not Included | Does not differentiate between emergency removal and placement | Yes | Yes | Yes (if in placement more than 7 days) |
Quick Facts
This tab provides quick facts displaying foster youth student data by program subgroup. Please visit the Foster Youth Data & Outcomes web page to access static data.
Census Day Enrollment Data
Annual enrollment consists of the number of students enrolled on Census Day (the first Wednesday in October). The table below shows the annual enrollment counts and percentages for each student subgroup tracked by the California Department of Education (CDE). The data included was submitted by local education agencies (LEAs) and charter schools to the CDE as part of the annual Fall 1 data submission to the California Longitudinal Pupil Achievement Data System.
Students in Foster Care Census Day Enrollment Trends Chart
Between 2021–22 and 2022–23 there was an almost 700 students in foster care increase. However, since 2022–23 to 2024–25 the enrollment of students in foster care is trending downward. This data comes from DataQuest’s Enrollment Multi-Year Summary by Grade report using the Foster program subgroup.
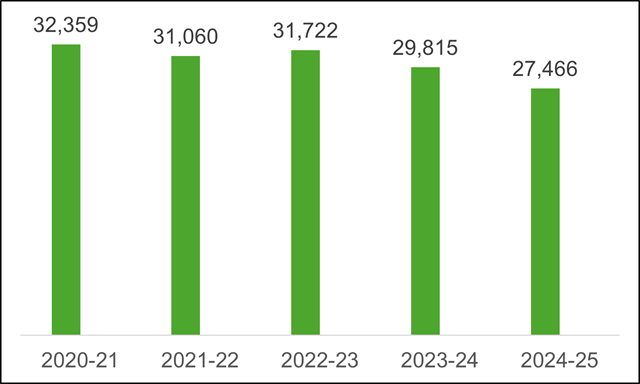
Students in Foster Care Census Day Enrollment Trends Table
| Academic Year | Foster |
|---|---|
| 2024–25 | 27,466 |
| 2023–24 | 29,815 |
| 2022–23 | 31,722 |
| 2021–22 | 31,060 |
| 2020–21 | 32,359 |
2024–25 Students in Foster Care by Grade Level Chart
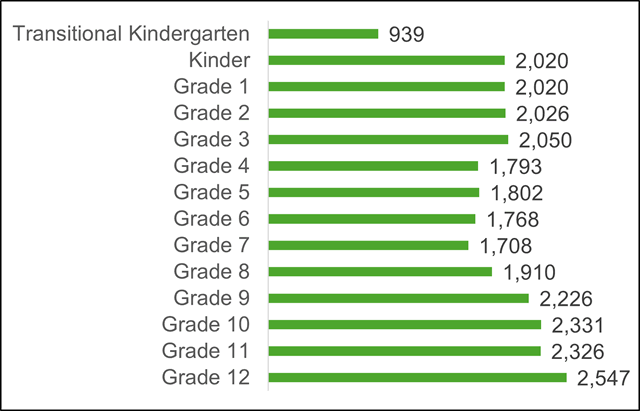
2024–25 Students in Foster Care by Grade Table
| Grade | Student Count |
|---|---|
| Grade 12 | 2,547 |
| Grade 11 | 2,326 |
| Grade 10 | 2,331 |
| Grade 9 | 2,226 |
| Grade 8 | 1,910 |
| Grade 7 | 1,708 |
| Grade 6 | 1,768 |
| Grade 5 | 1,802 |
| Grade 4 | 1,793 |
| Grade 3 | 2,050 |
| Grade 2 | 2,026 |
| Grade 1 | 2,020 |
| Kinder | 2,020 |
| Transitional Kindergarten | 939 |
2024–25 Student Group Census Day Enrollment Chart
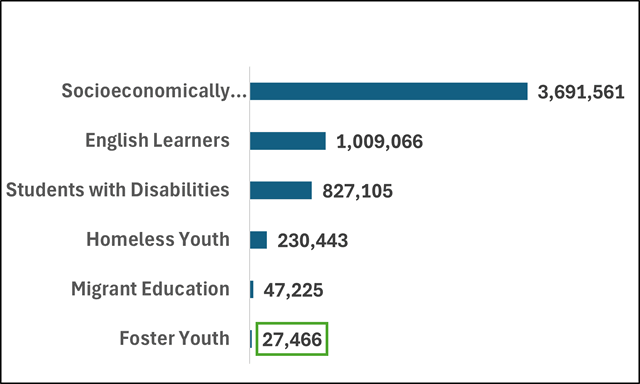
Subgroup counts are not mutually exclusive and therefore do not sum to the report total. Although students in foster care represent less than 1 percent of the student population, we will see that they continue to have dire outcomes on the outcomes and data tab. The table is modified from DataQuest 2024–2025 Enrollment by Subgroup for Charter and Non-Charter Schools Report. The table is modified from DataQuest 2024–2025 Enrollment by Subgroup for Charter and Non-Charter Schools Report.
| Program Student Group | Enrollment | Percentage |
|---|---|---|
| English Learners | 1,009,066 | 17.4% |
| Foster Youth | 27,466 | 0.5% |
| Homeless Youth | 230,443 | 4.0% |
| Migrant Education | 47,225 | 0.8% |
| Students with Disabilities | 827,105 | 14.2% |
| Socioeconomically Disadvantaged | 3,691,561 | 63.6% |
| All Students | 5,806,221 | 100% |
For more information on foster youth enrollment and to access downloadable files, including both state- and county-level data, visit the CDE Foster Youth Enrollment by School Type Data web page.
For more information on cumulative enrollment and downloadable cumulative enrollment data files visit the CDE Cumulative Enrollment Data web page.
More information on the different school types in California’s public-school system can be found on the CDE File Structure: Public Schools and Districts web page.
Data & Outcomes
State Level Educational Outcomes of Foster Youth
The outcomes for foster students, outlined below, are published annually. These outcomes and more can be accessed on DataQuest. DataQuest is the California Department of Education’s online, public reporting system that provides reports about California’s schools and school districts. To find out how to access reports specifically for foster youth on DataQuest, view these Instructions on Accessing Data(DOCX).
Chronic Absenteeism Trends
Chronic absence rate is calculated as the percentage of students, in transitional kindergarten through grade twelve, who miss 10 percent or more of the days they are expected to attend for. Chronic absenteeism for students in foster care is higher in 2024–25 than it was in 2020–21 but has declined since 2021–22. Between 2023–24 and 2024–25, Chronic absenteeism slightly increased by 0.3 percent for students in foster care and declined by 1 percent for non-foster students. Reports and information related to absenteeism are available on the Absenteeism Data web page.
Chronic Absenteeism Trends Chart
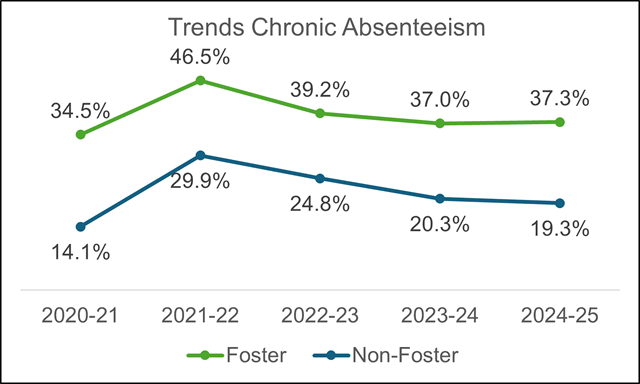
Chronic Absenteeism Trends Table
| Academic Year | Foster | Non-Foster |
|---|---|---|
| 2020–21 | 34.5% | 14.1% |
| 2021–22 | 46.5% | 29.9% |
| 2022–23 | 39.2% | 24.8% |
| 2023–24 | 37.0% | 20.3% |
| 2024–25 | 37.3% | 19.3% |
Suspension Rate Trends
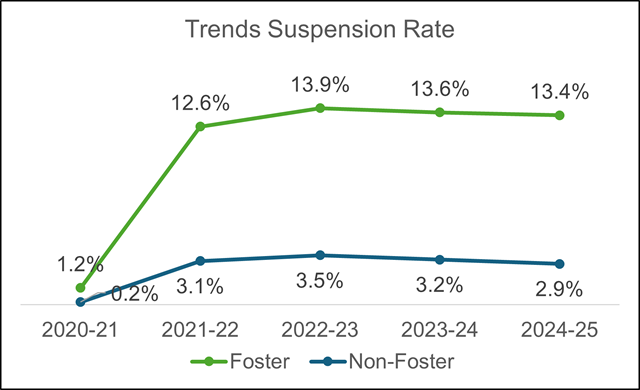
Suspension rate is calculated as the percentage of all students who were suspended one or more times during the school year for an in-school or out-of-school suspension. Suspension rate represents the unduplicated count of students suspended for any duration of time (partial day or full day) divided by the cumulative enrollment at the selected level (State, County, LEA, School). In 2020–21, the suspension rate dropped to 1.2 percent for students in foster care and to 0.2 percent for non-foster students. Between 2021–22 and 2022–23 suspension rates increased for both students in foster care and non- foster students. Between 2024–25, the suspension rate of students in foster care decreased by 0.2 percent points and dropped by 0.3 percent points for non-foster students. Suspension data and reports are available on the Discipline Data web page.
Suspension Rate Trends Chart
Suspension Rate Trends Table
| Academic Year | Foster | Non-Foster |
|---|---|---|
| 2020–21 | 1.2% | 0.2% |
| 2021–22 | 12.6% | 3.1% |
| 2022–23 | 13.9% | 3.5% |
| 2023–24 | 13.6% | 3.2% |
| 2024–25 | 13.4% | 2.9% |
Four-Year Adjusted Cohort Graduation Rate Trends
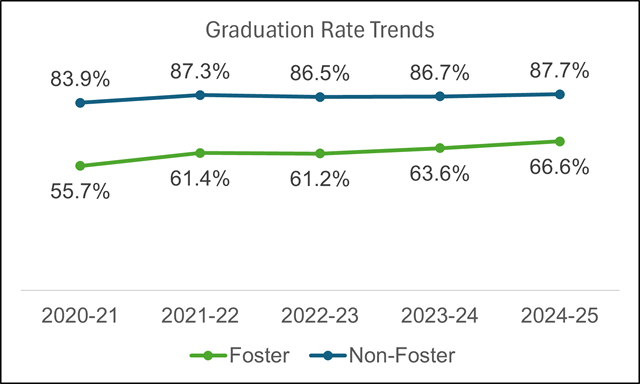
The four-year adjusted cohort graduation represents the percentage of students who graduate high school in four years with a traditional high school diploma divided by the number of students who form the adjusted cohort for the graduating class. The four-year cohort is based on the number of students who enter grade 9 for the first time adjusted by adding into the cohort any student who transfers in later during grade 9 or during the next three years and subtracting any student from the cohort who transfers out, emigrates to another country, transfers to a prison or juvenile facility, or dies during that same period. Between 2023–24 and 2024–25, the graduation rate for students in foster care increased by 3 percent and by 1 percent for non-foster students. Four-year adjusted cohort graduation data as well as five-year adjusted cohort graduation rate reports are available on the Graduation and Dropout Data web page.
Four-Year Adjusted Cohort Graduation Rate Trends Chart
Graduation Rate Trends Table
| Academic Year | Foster | Non-Foster |
|---|---|---|
| 2020–21 | 55.7% | 83.9% |
| 2021–22 | 61.4% | 87.3% |
| 2022–23 | 61.2% | 86.5% |
| 2023–24 | 63.6% | 86.7% |
| 2024–25 | 66.6% | 87.7% |
Graduation Exemption Rate Trends
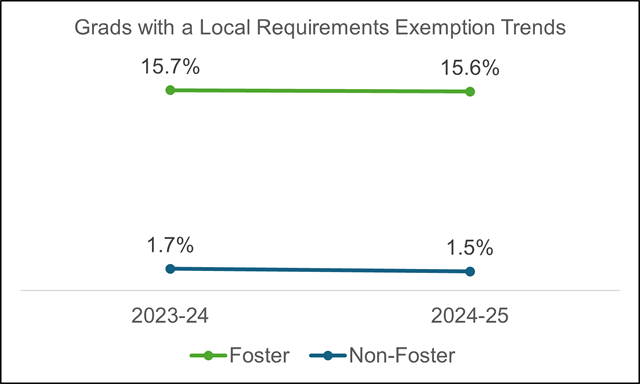
The Graduates Receiving a Local Requirements Exemption rate shows the percentage of graduating high school students who completed all state graduation requirements for a standard high school diploma but were exempt from local graduation requirements. This is a new measure which began in 2023–24 pursuant to Education Code Section 51225.1(s) which allows foster and homeless youth to graduate exempt from meeting the local graduation requirements. In the past two school years we can see that students in foster care graduate with this exemption at higher rates than students not in foster care. This data and other graduation reports are available on the Graduation and Dropout Data web page.
Graduation Exemption Rate Trends Chart
Graduation Exemption Trends Table
| Academic Year | Foster | Non-Foster |
|---|---|---|
| 2023–24 | 15.7% | 1.7% |
| 2024–25 | 15.6% | 1.5% |
Dropout Rate Trends
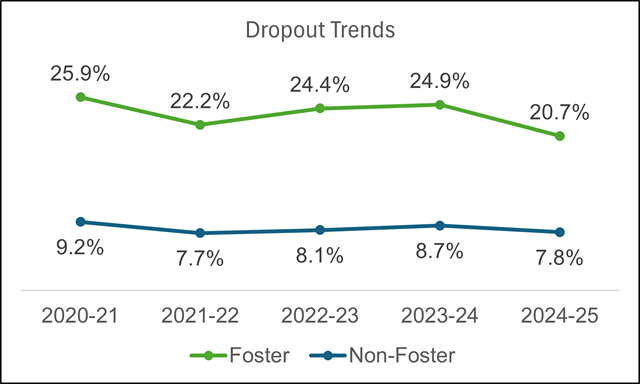
The four-year adjusted cohort dropout rate is calculated as the percent of cohort students who (1) do not graduate with a regular high school diploma, (2) do not otherwise complete high school, or (3) are not still enrolled as a “fifth year senior.” Between 2023–24 and 2024–25, the dropout rate dropped by 4.2 percent points for students in foster care and by 0.9 percent for non-foster students. Dropout data and other graduation reports are available on the Graduation and Dropout Data web page.
Dropout Rate Trends Chart
Dropout Rate Trends Table
| Academic Year | Foster | Non-Foster |
|---|---|---|
| 2020–21 | 25.9% | 9.2% |
| 2021–22 | 22.2% | 7.7% |
| 2022–23 | 24.4% | 8.1% |
| 2023–24 | 24.9% | 8.7% |
| 2024–25 | 20.7% | 7.8% |
Stability Rate Trends
The stability rate represents the percentage of students with continuous enrollment in the same school divided by the adjusted cumulative enrollment at a selected entity (State, County, District, School). A student has continuous enrollment if they are enrolled in the same school for 245 consecutive calendar days without a disqualifying exit. Disqualifying exits are as follows: (1) E140 Truant, no subsequent enrollment, (2) E300 Expelled, no subsequent enrollment, and (3) E400: Unknown, no subsequent enrollment. Since the 2021–22 academic year, the stability rate for students in foster care has improved each year. Between 2023–24 and 2024–25, the stability rate of students in foster care increased by 0.4 percent and by 0.5 percent for non-foster students. Stability rate data and reports are available on the Stability Rate Data web page.
Stability Rate Trends Chart
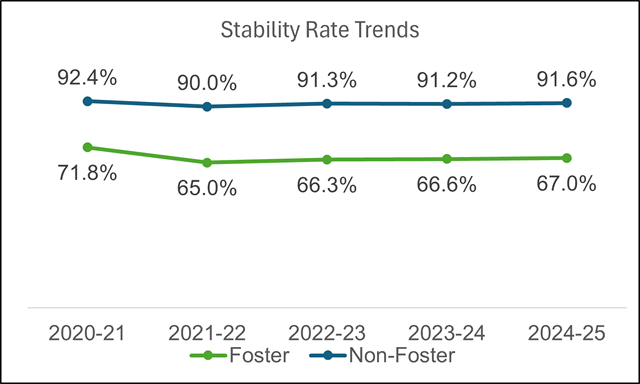
Stability Rate Trends Table
| Academic Year | Foster | Non-Foster |
|---|---|---|
| 2020–21 | 71.8% | 92.4% |
| 2021–22 | 65.0% | 89.8% |
| 2022–23 | 66.3% | 91.3% |
| 2023–24 | 66.6% | 91.2% |
| 2024–25 | 67.0% | 91.6% |
Downloadable files, which include both state- and county-level data, can be accessed through the CDE Data and Statistics Student and School Data Files web page at Foster Youth Data Page.
More information on cumulative enrollment and downloadable cumulative enrollment data files can be accessed on the CDE Data and Statistics web page at Cumulative Enrollment Data Page.
More information on the different school types in California’s public school system can be found on the CDE Data and Statistics web page at Public Schools and Districts File Structure Page.
State Level Accountability for Foster Youth
This tab provides the latest statewide accountability indicators for foster youth.

California's accountability system is a multiple measures system that assesses how local educational agencies (LEAs) and schools are meeting the needs of their students. Performance on these measures is reported through the California School Dashboard
![]() .
.
The California School Dashboard (Dashboard) includes Performance Levels (or colors) for state indicators, which are determined using current year performance (or Status) and the difference from prior year (or Change) to show growth or decline. This results in five color-coded Performance Levels for each indicator. From highest to lowest, the Performance Levels are: Blue, Green, Yellow, Orange, and Red. For more information, please visit the Five-By-Five Colored Tables web page.
The 2024–25 accountability measures and historical foster youth performance can be found on the California School Dashboard
![]() .
.
For more information, resources, and guidance for the Dashboard and System of Support, please visit the California School Dashboard and System of Support web page.
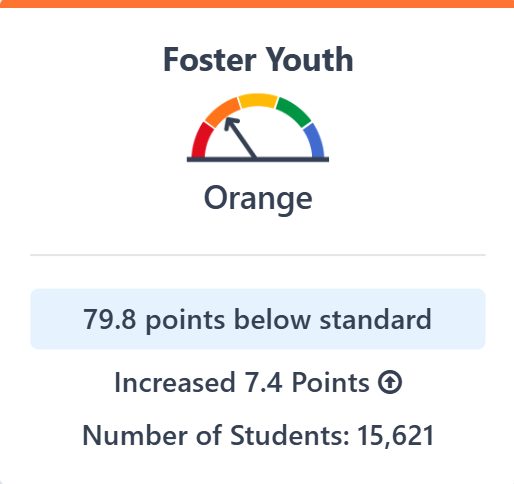
English Language Arts
This measure of the Academic Performance state indicator reports student progress on the statewide assessment for English Language Arts/Literacy. It uses the Smarter Balanced Summative Assessments and California Alternate Assessments, and it is calculated based on the average "Distance from Standard" for all students in grades 3 through 8 and/or grade 11. In 2024–25, the foster youth student group has an 'Orange' performance level, 'Increased' the level by 7.4 points, and scored 79.8 points below standard compared to the statewide average of 8.1 points below standard for all students. This data is available on the California School Dashboard English Language Arts
![]() .
.
Number of Students: 15,621
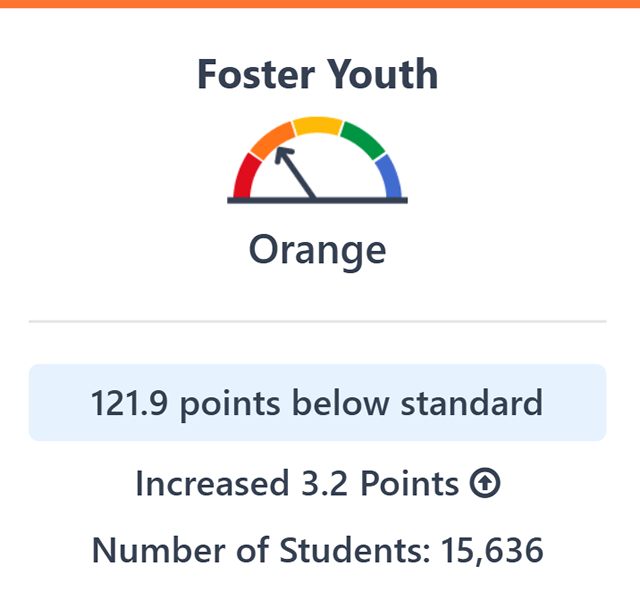
Mathematics
This measure of the Academic Performance state indicator reports student progress on the statewide assessment for mathematics. It uses the Smarter Balanced Summative Assessments and California Alternate Assessments, and it is calculated based on the average "Distance from Standard" for all students in grades 3 through 8 and/or grade 11. The foster youth student group has an ‘Orange’ performance level, increased by 3.2 points, and scored 121.9 points below standard compared to the statewide average of 42.4 points below standard for all students. This data is available on the California School Dashboard Mathematics
![]() .
.
Number of Students: 15,636
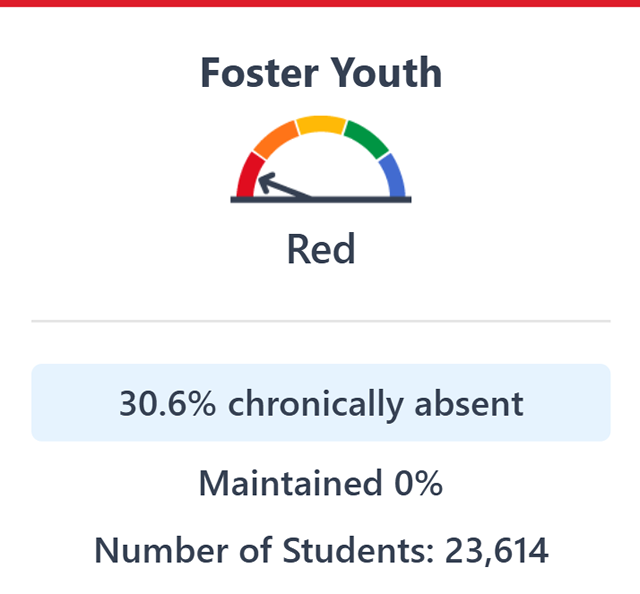
Chronic Absenteeism
The Chronic Absenteeism state indicator shows how many students in transitional kindergarten through eighth grade were absent for 10 percent or more of the total instructional school days each student was expected to attend. The foster youth student group has a 'Red' performance level maintained by 0 percent. In the 2024–25, 30.6 percent of foster youth students in transitional kindergarten through eighth grade were chronically absent compared to the statewide rate of 17.1 percent for all students. This data is available on the California School Dashboard Chronic Absenteeism
![]() .
.
Number of Students: 23,614
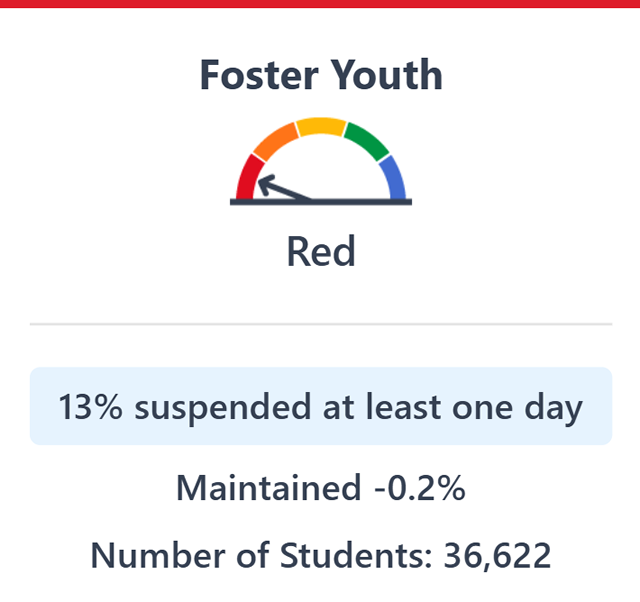
Suspension Rate
The Suspension Rate state indicator reflects the percentage of students in transitional kindergarten through grade 12 who have been suspended at least one day in a given school year. Students who are suspended multiple times are only counted once. The foster youth student group has a 'Red' performance level 'Maintained’ by -0.2 percent. In 2024–25, 13 percent of the foster youth student group were suspended for at least one day compared to the statewide rate of 2.9 percent for all students. This data is available on the California School Dashboard Suspension Rate
![]() .
.
Number of Students: 36,622
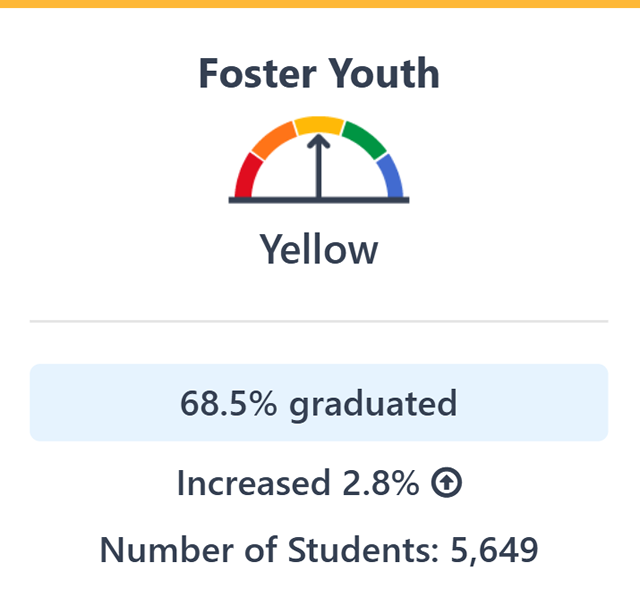
Graduation Rate
The Graduation Rate state indicator reflects the percentage of students who graduate with a regular high school diploma in four years or five years. The foster youth student group has a 'Yellow' performance level increased by 2.8 percent. In 2024–25, 68.5 percent of foster youth students graduated compared to the statewide rate of 87.8 percent for all students. This data is available on the California School Dashboard Graduation Rate
![]() .
.
Number of Students: 5,649
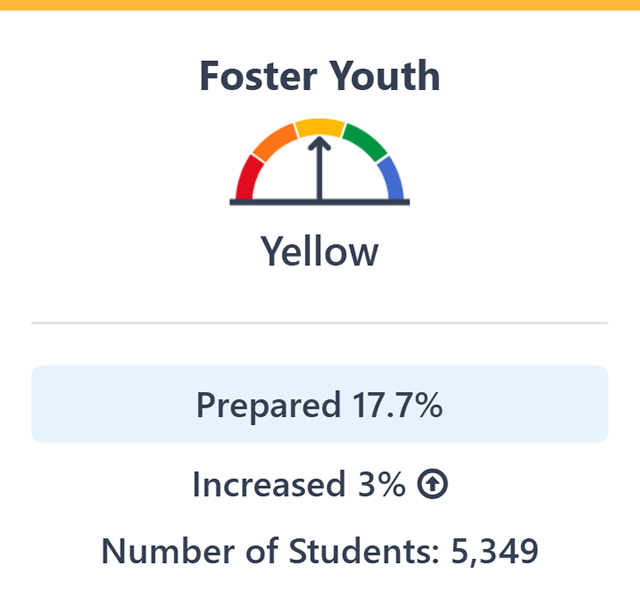
College/Career
The College/Career Readiness state indicator shows how many students graduate from high school better prepared for college or a career. It uses various college and career measures, such as completion of coursework, work experience, and exam results. The foster youth student group has a 'Yellow' performance level increased by 3 percent. In 2024–25, 17.7 percent of the foster youth student group are prepared for college or a career compared to the statewide rate of 51.7 percent for all students. This data is available on the California School Dashboard College and Career
![]() .
.
Number of Students: 5,349
State Level Accountability for Foster Youth
As noted, California’s public-school accountability system is designed to reinforce the expectation that everyone can improve while also ensuring additional support is provided to LEAs that are struggling. It also includes an intentional focus on aiding in a manner that builds capacity of the LEA receiving assistance. Differentiated assistance is therefore intended not only to help the LEA address the underlying causes that led to its eligibility for assistance, but also to strengthen the LEA’s overall ability to evaluate the effectiveness of strategies and programs and adjust as appropriate. This approach equips the LEA to improve in areas that were not the focus of differentiated assistance and increases the likelihood that improvements will be sustained when the differentiated assistance ends. To be eligible for assistance, the same student group must meet the criteria in two different priority areas. To learn more about the eligibility for differentiated assistance please visit LEA Criteria for Differentiated Assistance.
2025 LCFF Assistance Status
2025 LCFF COE/District Assistance Status Spreadsheet(XLSX)
2025 LCFF Charter School Assistance Status Spreadsheet(XLSX)
Local Control Accountability Plan
In order to create a clear connection between an LEA’s performance and the planning process articulated in the LEA's Local Control Accountability Plan (LCAP), California Education Code (EC) Section 52064 was amended to include a requirement that an LEA that meets certain criteria include one or more specific goals in the LCAP focused on improving student outcomes of low-performing student groups and/or schools. The legislative intent of these requirements is two-fold: first, to ensure that LEAs address the needs of consistently low-performing student groups; and second, to ensure that higher performing LEAs address the needs of low-performing schools within the LEA. There are 38 LEAs that must include a specific goal for foster youth in their LCAP in the 2023–24 school year.
The CDE has prepared files below that indicate the LEAs that have met the criteria to include one or more specific goals in the LCAP.
LCAP Required Goals Lists
LEAs required to include a goal in the 2023–24 LCAP based on student group performance(XLSX)
LEAs required to include a goal in the 2023–24 LCAP based on school performance(XLSX)
Education Rights of Foster Youth
Foster youth have unique needs and specific educational rights to support these students’ success in California schools.
A summary of the California Education Codes pertaining to foster youth is available on the Foster Youth Education Rights web page on the California Department of Education’s website.
Download the Foster Youth Education Law Fact Sheets created by the California Foster Youth Education Task Force (CFYETF) from the links below. These fact sheets are located on CFYETF's website and provide information on the needs and rights of foster youth in California schools.
California Foster Youth Education Law Fact Sheets in English
![]() (PDF)
(PDF)
California Foster Youth Education Law Fact Sheets in Spanish
![]() (PDF)
(PDF)
The Foster Youth Definitions(XLSX) document provides reference information on the educational supports and entitlements for foster youth. This document is for reference purposes only, may not be comprehensive, and is subject to change depending on federal and state statutes and regulations.
California Legislation on Foster Youth
This legislation, enacted in 2020, requires Foster Youth Services Coordinating Programs to coordinate efforts to ensure, to the extent possible, the completion of the Free Application for Federal Student Aid or the California Dream Act Application for foster youth pupils who are in grade 12.
Assembly Bill 490 (2003)
![]() (PDF)
(PDF)
This legislation was enacted in 2003 to address many of the barriers to equal educational opportunities for foster children and youth and expands and stipulates authority for school records of foster youth.
This legislation was enacted in 2013 to address high school graduation requirements for pupils in foster care.
This legislation enacted in 2015, also known as the Continuum of Care Reform bill, addresses foster care placement and foster care placement funding.
This legislation was enacted in 2015 to establish the Foster Youth Services Coordinating Program to coordinate and ensure that local educational agencies provide services to foster youth focused on positive educational outcomes.
This legislation enacted in 2018, also known as the Foster youth: trauma-informed system of care bill, requires each county to develop a Memorandum of Understanding (MOU) to describe the roles and responsibilities of certain entities that serve youth in foster care who have experienced severe trauma. The legislation also instructs the Secretary of California Health and Human Services and the Superintendent of Public Instruction to establish a joint interagency resolution team to implement and review aspects of the MOU.
More information on the education rights of foster youth can be found on the California Department of Education’s Foster Youth Services Program Resources.
Complete information on the educational rights of foster youth can be found on the California Legislative Information website
![]() .
.
Partnerships
Foster Youth Services Coordinating Program (FYSCP)
The FYSCP is a grant program for each county office of education to support interagency collaboration and capacity building, both at the system and individual student level, focused on improving educational outcomes for students in foster care.
Visit CDE's Foster Youth Services site for more information including an overview of the Foster Youth Services Coordinating Program, grantee information, and CDE contact information.
Visit Foster Youth Services Program Resources for links to many informational resources and agencies which support the FYSCP and the needs of foster youth.
California Department of Social Services (CDSS)
California legislation requires the California Department of Education, in collaboration with the California Department of Social Services, to share and, through a statewide match process, inform districts regarding which of their students are foster youth (either living at home receiving family maintenance services or in out-of-home placements) on a weekly basis so that these students can best be served and receive appropriate educational supports and services. This is done through a weekly statewide foster match process.
Visit the California legislative information website for more information on Education Code 49085![]() which defines the data sharing requirements between the CDE and the CDSS pursuant to Education Code 49085.
which defines the data sharing requirements between the CDE and the CDSS pursuant to Education Code 49085.
Other Partnerships and Organizations
The California Department of Education partners with multiple state and non-profit organizations to collaborate on the support of foster youth in California Schools. Below are links to some of these agencies’ websites with information on foster youth.
California Foster Youth Education Task Force![]()
California Department of Social Services![]()
Alliance for Children's Rights![]()
California Child Welfare Council![]()
California CASA - Court Appointed Special Advocates for Children![]()