
Home-to-School Transport Reimbursement Summary
Information and resources for the statewide home-to-school transportation reimbursement summary for 2022-23.Data source: 2022-23 Home-to-School Transportation Reimbursement Data Collection Report (XLSX)
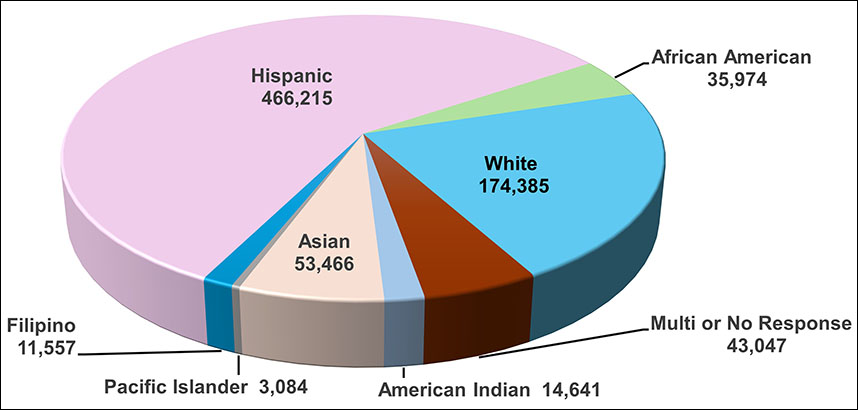
Total Rider Demographics supported by Home-to-School Transportation Reimbursement Program
| American Indian | Asian | Pacific Islander | Filipino | Hispanic | African American | White | Multi or No Response | Total Riders |
|---|---|---|---|---|---|---|---|---|
14,641 |
53,466 |
3,084 |
11,557 |
466,215 |
35,974 |
174,385 |
43,047 |
802,369 |
Total Statewide Local Education Agency (LEA) Expenditures for Home-to-School Transportation: $1,587,122,600
Total Reimbursement Allocations for Home-to-School Transportation Reimbursement Program: $585,699,186
Total Mileage: 130,984,803
Total Routes: 101,986
Average Daily Ridership: 445,407
Lap/Shoulder Belt Equipped Buses: 19,245
Total Socioeconomically Disadvantaged Riders supported by Home-to-School Transportation Reimbursement Program
| Socioeconomically Disadvantaged Riders (SDR) | SDR (By percentage) | Non-Socioeconomically Disadvantaged Riders (Non-SDR) | Non-SDR (By percentage) | Total Riders |
|---|---|---|---|---|
345,512 |
43% |
456,857 |
57 % |
802,369 |

Total Fuel Sources by Home-to-School Transportation Reimbursement Program Participants
| Diesel | Bio-Diesel | Gasoline | Propane | Electric | Hydrogen | Methanol | Compressed Natural Gas (CNG) | Total Fuel Types |
|---|---|---|---|---|---|---|---|---|
662 |
45 |
421 |
57 |
188 |
9 |
1 |
167 |
1,550 |

Questions:
Office of School Transportation | HTSRP@cde.ca.gov | 916-375-7100
Last Reviewed: Monday, March 16, 2026
Trending in Transportation
Recently Posted in Transportation
No items posted in the last 60 days.